News
Estimating footprints: gear type and fishing intensity
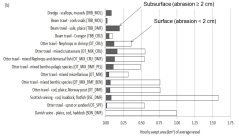
Different types of fisheries such as beam trawling, Scottish seine or flyshoot differ greatly in their footprint: the area trawled per hour.


Scottish seining has the largest footprint of 1.6 km2 per hour, but the impact is mainly on the surface level: the impact on the subsurface level (deeper than 2 cm) is 0.08 km2/h. In contrast, beam trawling for flatfish has a lower overall footprint, but ranks substantially higher when comparing only impact at the subsurface level (0.19 km2/h).
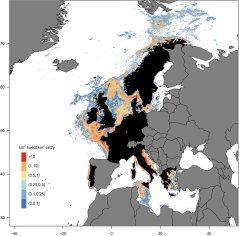
Trawling intensity maps were created by combining the fishing position recorded by satellite (VMS) with the metier information of the vessel from the EU-logbooks and the estimate of the typical footprint for each metier. Mean trawling intensity ranged between 0.5 and 8.5 times per year in waters down to 200 m depth, but was slightly less in the deeper water (200-1000m). Highest intensities were recorded in the Skagerrak-Kattegat, Celtic Sea, Bay of Biscay, Iberian Portuguese area, Tyrrhenian Sea and Adriatic Sea.
90% of the fishing effort takes place in 50% of the area
Between 15% and 72% of the seabed area was untrawled across the analysed management areas. This estimate applies to the 3-year study period. It is unlikely, however, that the untrawled seafloor in the study period will remain untrawled when studied over a longer time period. A more cautious estimate of the untrawled seafloor is given by the proportion of the grid cells without trawling activities, which ranged between 1 and 47 %. Within the area trawled, trawling is highly aggregated with 90 % of the effort occurring in around 50 % of the gridcells. This implies room for a significant reduction of trawling impact at a minimal cost for the fishery. Because of the aggregated nature of trawling, the footprint estimates are scale dependent.
More information:
- Unfortunately, your cookie settings do not allow videos to be displayed. - check your settings
- Eigaard, O. R., Bastardie, F., Breen, M., Dinesen, G. E., Hintzen, N. T., Laffargue, P., Mortensen, L. O., et al. 2016. Estimating seabed pressure from demersal trawls, seines, and dredges based on gear design and dimensions. ICES Journal of Marine Science: Journal du Conseil, 73: i27-i43.
- Eigaard, O. R., Bastardie, F., Hintzen, N. T., Buhl-Mortensen, L., Buhl-Mortensen, P., Catarino, R., Dinesen, G. E., et al. 2017. The footprint of bottom trawling in European waters: distribution, intensity, and seabed integrity. Ices Journal of Marine Science, 74: 847-865.
